BROKEN BUILD?ALREADY FIXED.
Your build logs already contain the clues. Daxtack turns them into a reviewable root-cause analysis and suggested fix without hours of manual triage. The on-prem agent sanitizes log context first, so source code never leaves your network.
Spend less time
inside failed pipelines.
Keep shipping.
Daxtack is for teams that want a cleaner incident workflow, not another dashboard full of vague AI output.
With Daxtack's on-premise agent, you surface likely root cause, suggested fixes, and a reviewable incident trail without exposing a single line of source code.
The goal is straightforward: fewer manual handoffs and faster, more confident recovery when CI breaks.
Less Manual Triage
Capture the failure once and keep the context attached.
The agent captures build output from your existing CI stack, sanitizes it, and hands AI the failure context directly. Engineers review the output instead of copying logs between tools.
Fewer Re-runs
Shorter incident loops mean less wasted pipeline time.
When teams get a concrete root-cause summary and a proposed fix quickly, they spend less time retrying builds and less time pulling senior engineers into routine failures.
Keep Delivery Moving
Debugging stops interrupting feature work.
Daxtack turns failure analysis into a repeatable workflow, so engineers can review the diagnosis, patch, and PR in one place instead of context-switching across terminals, chats, and dashboards.
Reviewable Incident History
Each failure analysis stays visible after the incident is over.
Each analysis keeps the failure context, generated reasoning, and recommended fix attached to the record so teams can review what happened and share it internally.
Proven by leading
engineering teams
Increase deployment velocity and close incidents faster through smarter log intelligence.
Keep your current CI stack and failure workflow.
Sanitize build output before it reaches an AI model.
Use the free plan for hands-on evaluation and bring sales in when procurement matters.
Review the free plan on real failures, then move to a sales-led rollout if you need private deployment, procurement review, or team-wide controls.
0
Inbound ports required by the on-prem agent
0
CI platforms shown on the landing page
0
Analyses included each month on the free plan
Architecture
From failure to fix,
without copy-paste triage.
Your build fails. The agent sanitizes context, analyzes the issue, and returns a concrete next step.
CI Pipeline
Jenkins · GitHub Actions · GitLab
Build Fails
Raw logs available
Build breaks
When your CI pipeline fails, Daxtack captures the full build output — logs, errors, stack traces — from your existing tools. No SDK, no code changes.
Strip Secrets
API keys, tokens, creds
Remove PII
Emails, names, IPs
Extract Context
Error patterns only
Agent processes locally
Running inside your network, the agent strips credentials, removes PII, and reduces raw build output into sanitized error context for analysis. Source code never leaves.
AI Analysis
Claude · GPT · Gemini
Fix + Pull Request
Root cause · Suggested patch
AI analyzes the failure
Sanitized context hits our multi-model AI layer. Daxtack returns a likely root cause, a suggested fix, and a reviewable next action without manual log hunting.
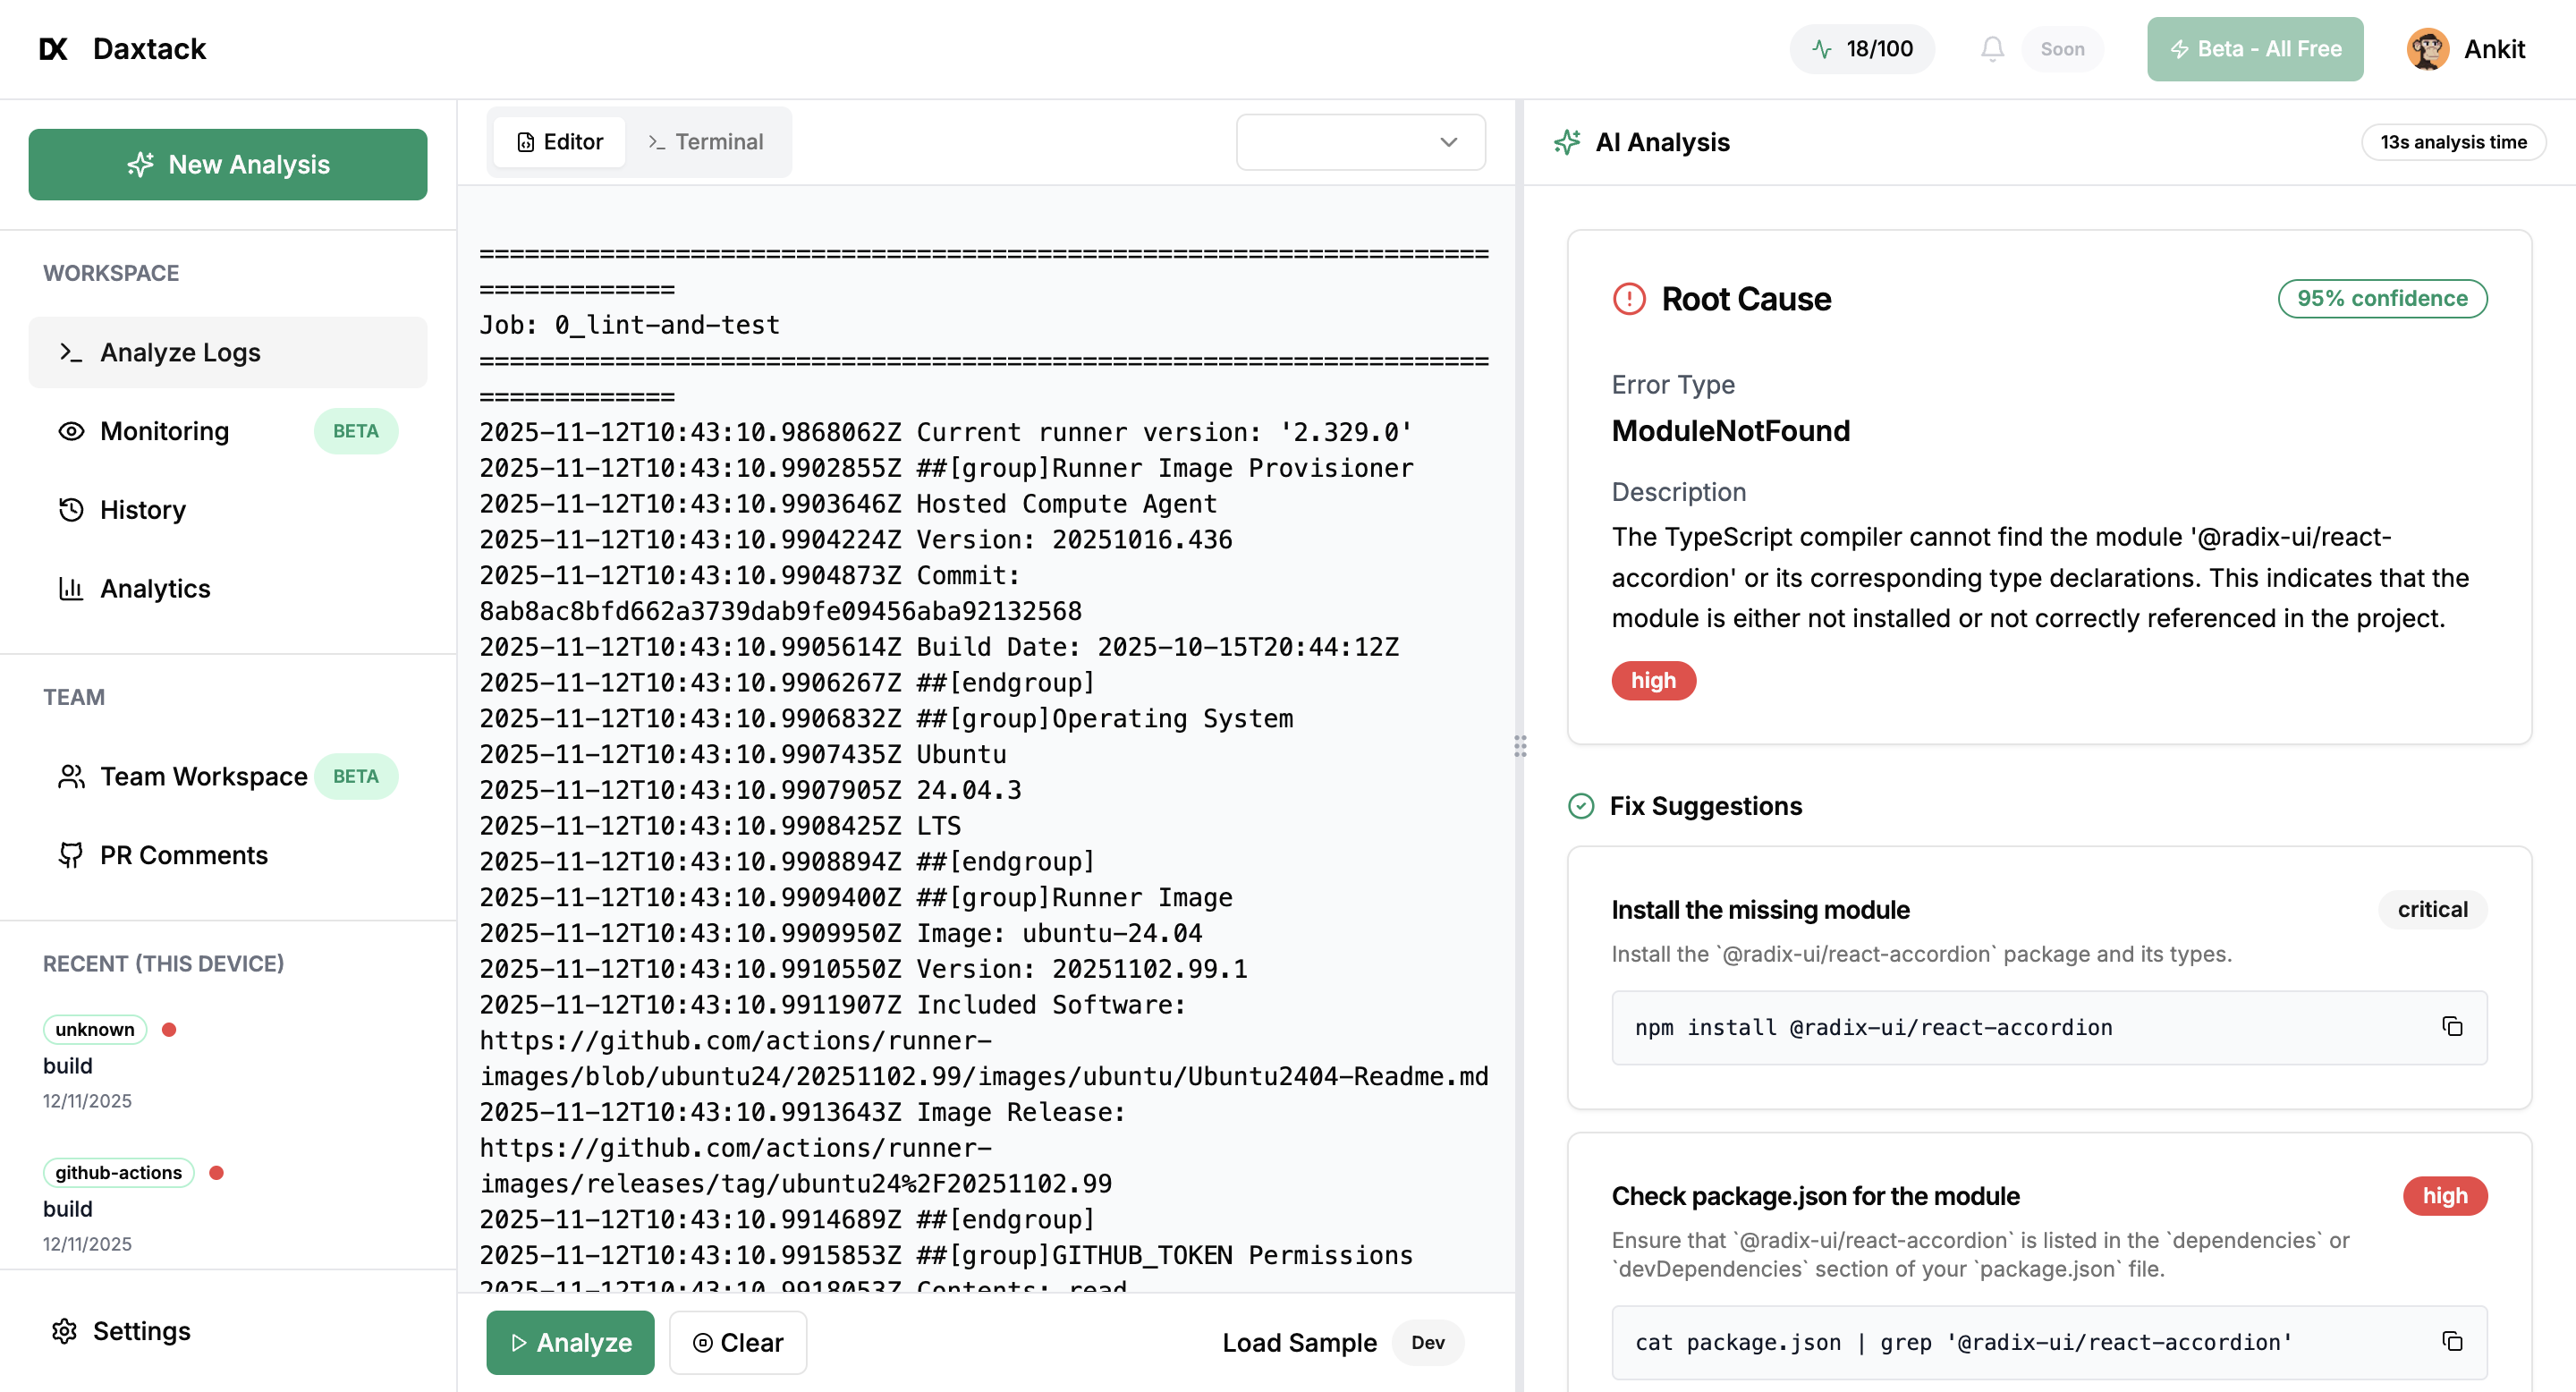
Live Analysis
See it in action
Root cause identified. Fixes ranked by success rate. Ready to apply.
Security
Built for teams where security
isn't negotiable
- Privateby design
Zero Code Visibility
We only analyze error context. Your source code and intellectual property remain entirely private.
- Localscrubbing
Secret Detection
API keys, tokens, credentials and PII are automatically stripped before any data leaves your network.
- 0inbound ports
Outbound Only
No open inbound ports. The agent initiates all connections — your firewall stays locked down.
- Minimaldata sent
Data Minimization
Only sanitized error context is sent for analysis. Full raw logs stay in your environment.
- Traceablehistory
Reviewable Analysis History
Keep a clear record of what failed, what was analyzed, and what fix was suggested. Useful for internal reviews and security-conscious teams.
Platform
Everything you need to ship faster
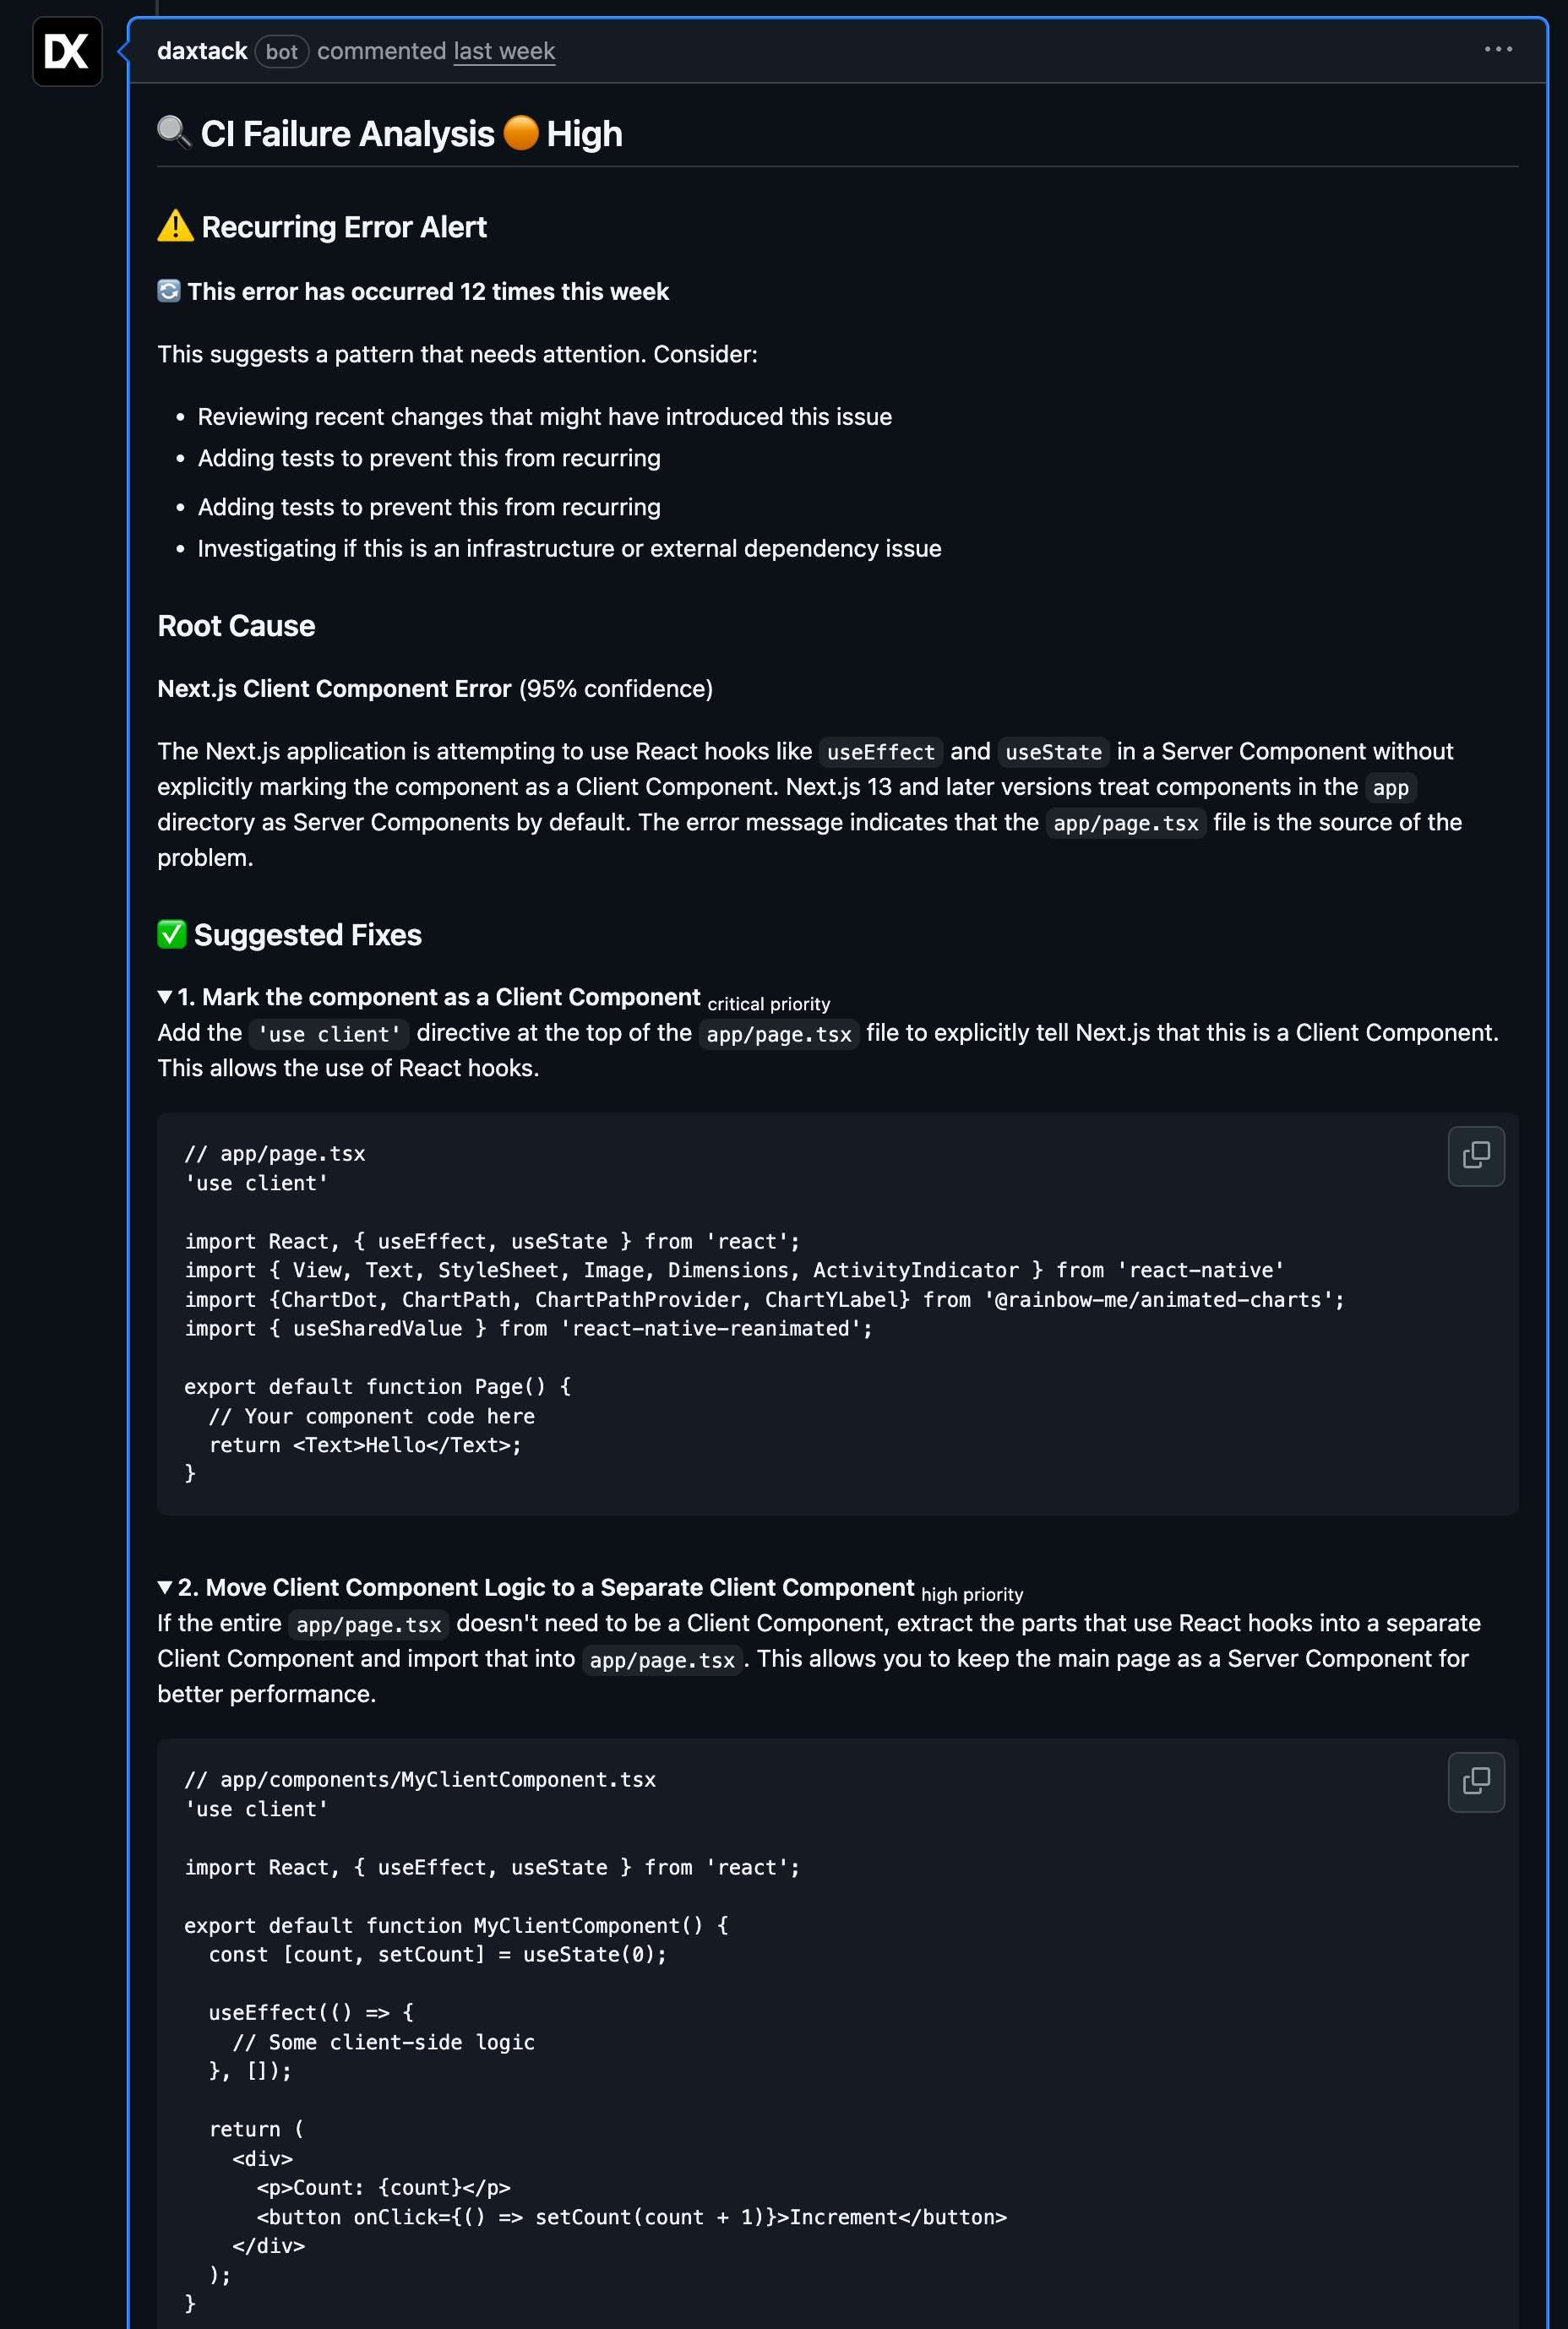
PR Auto-Comments
Fixes appear directly on your pull requests within seconds.
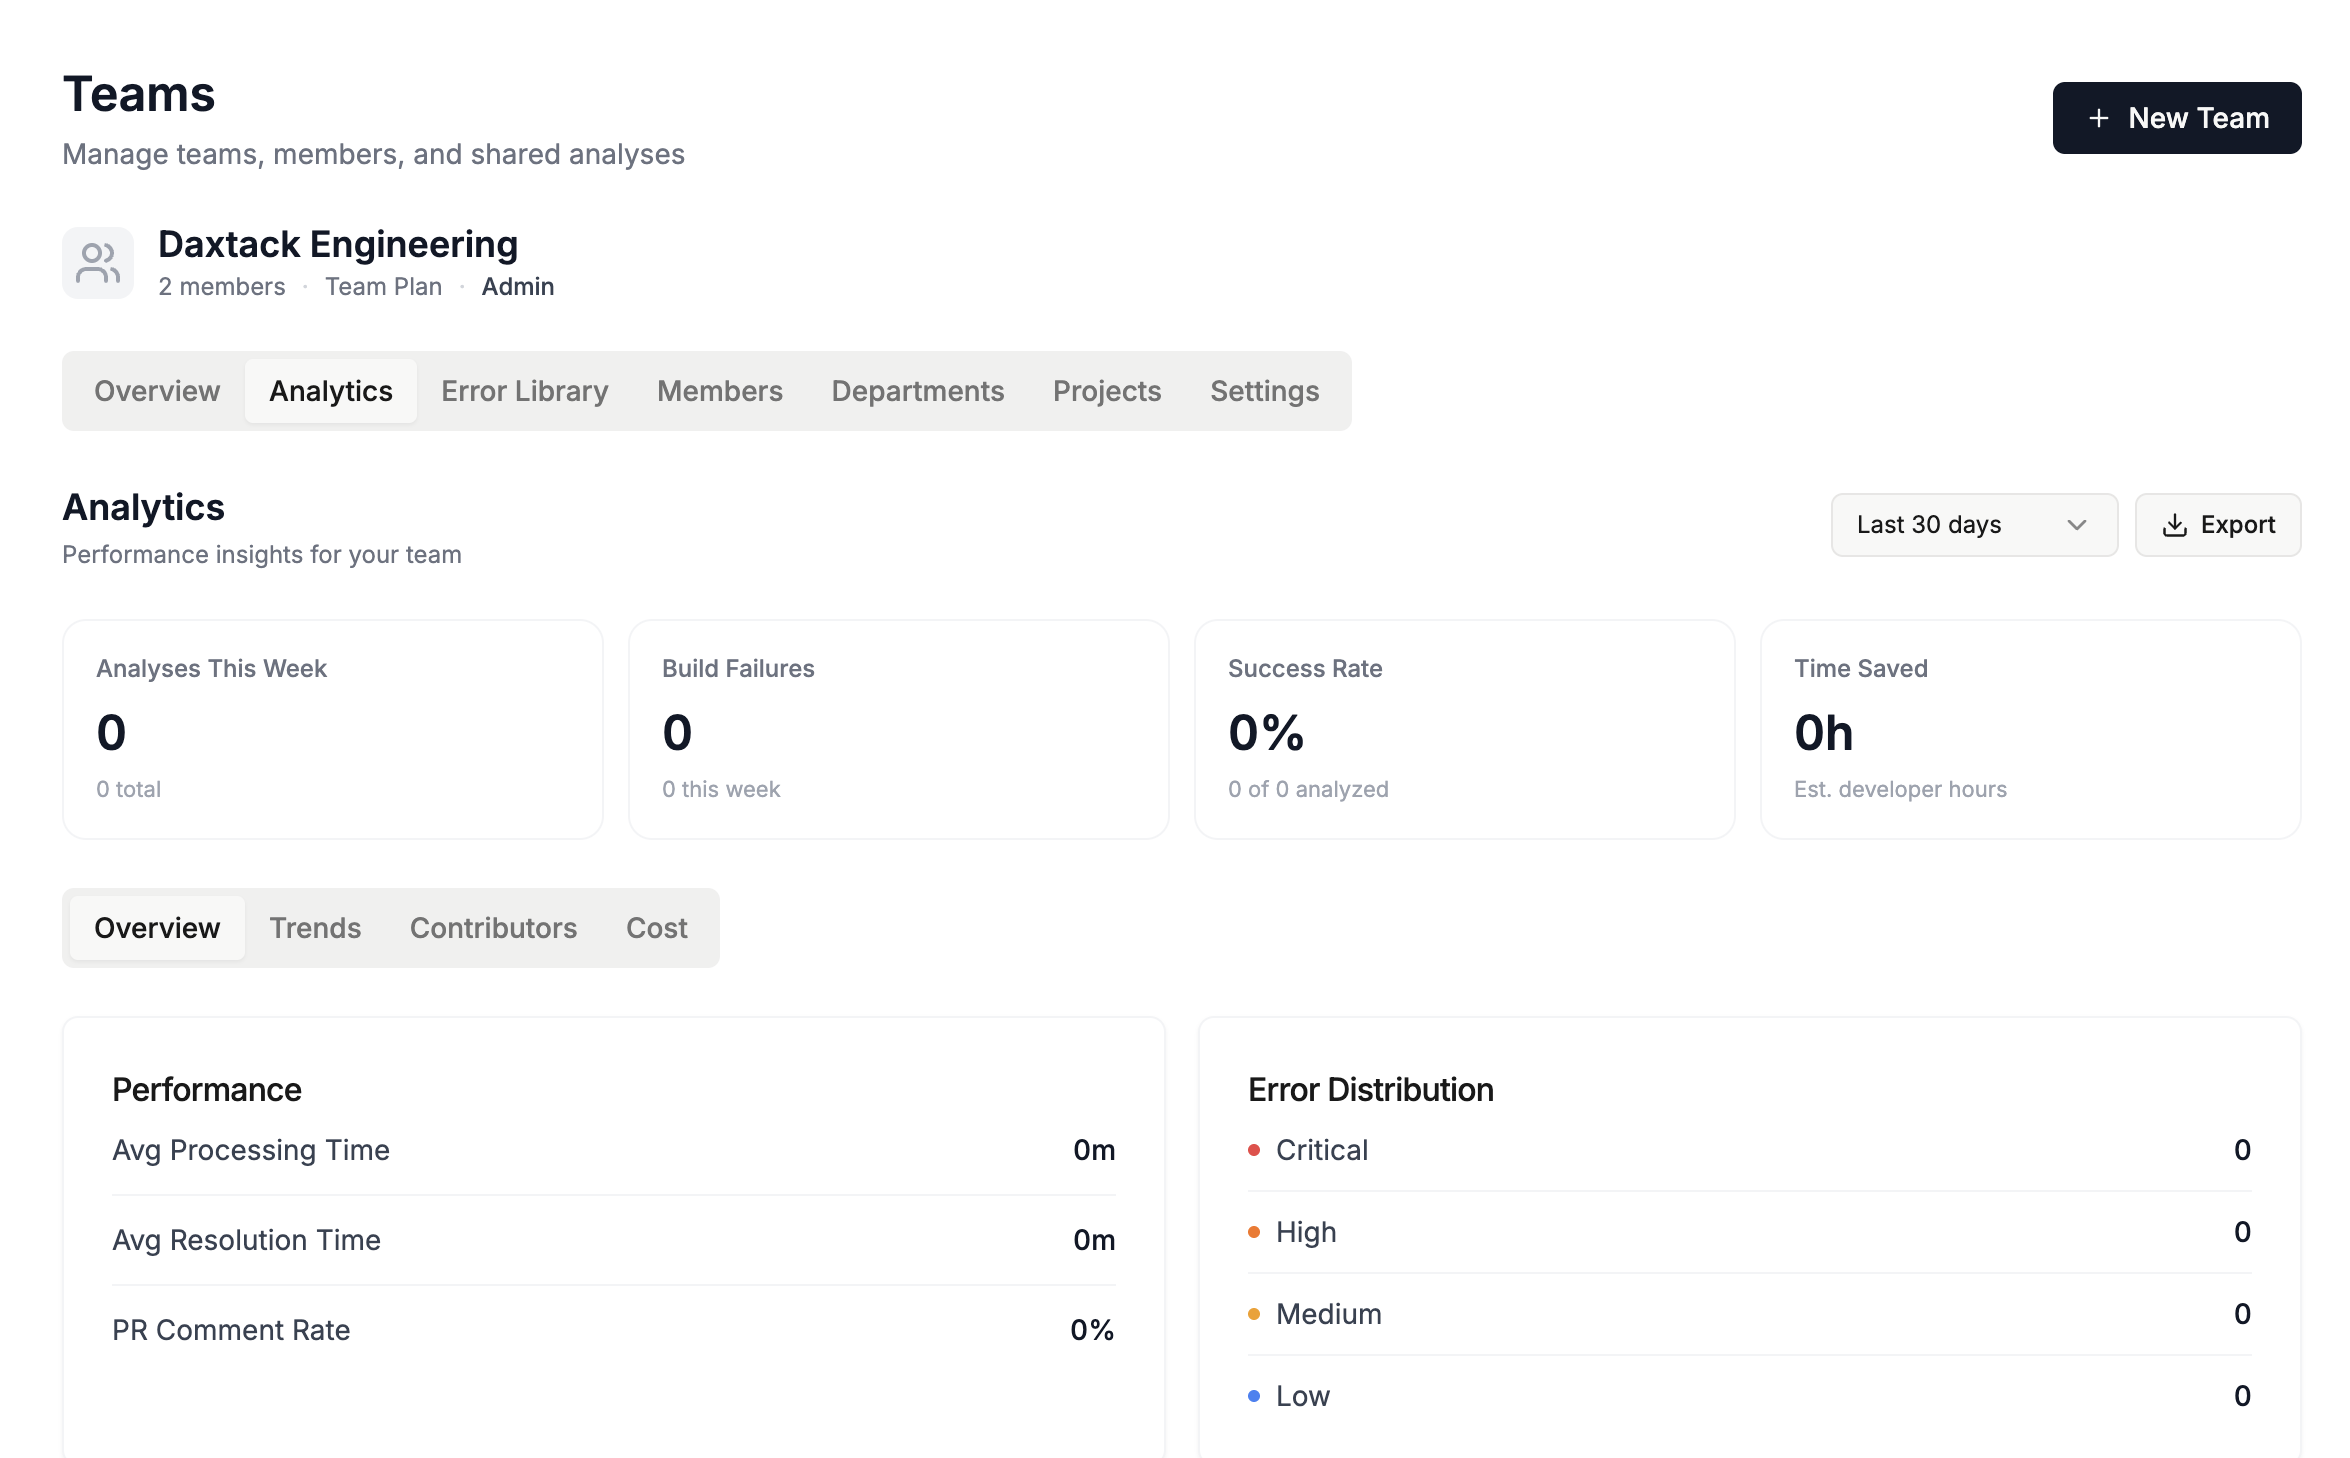
Team Analytics
Track patterns, velocity, and recurring issues across your team.
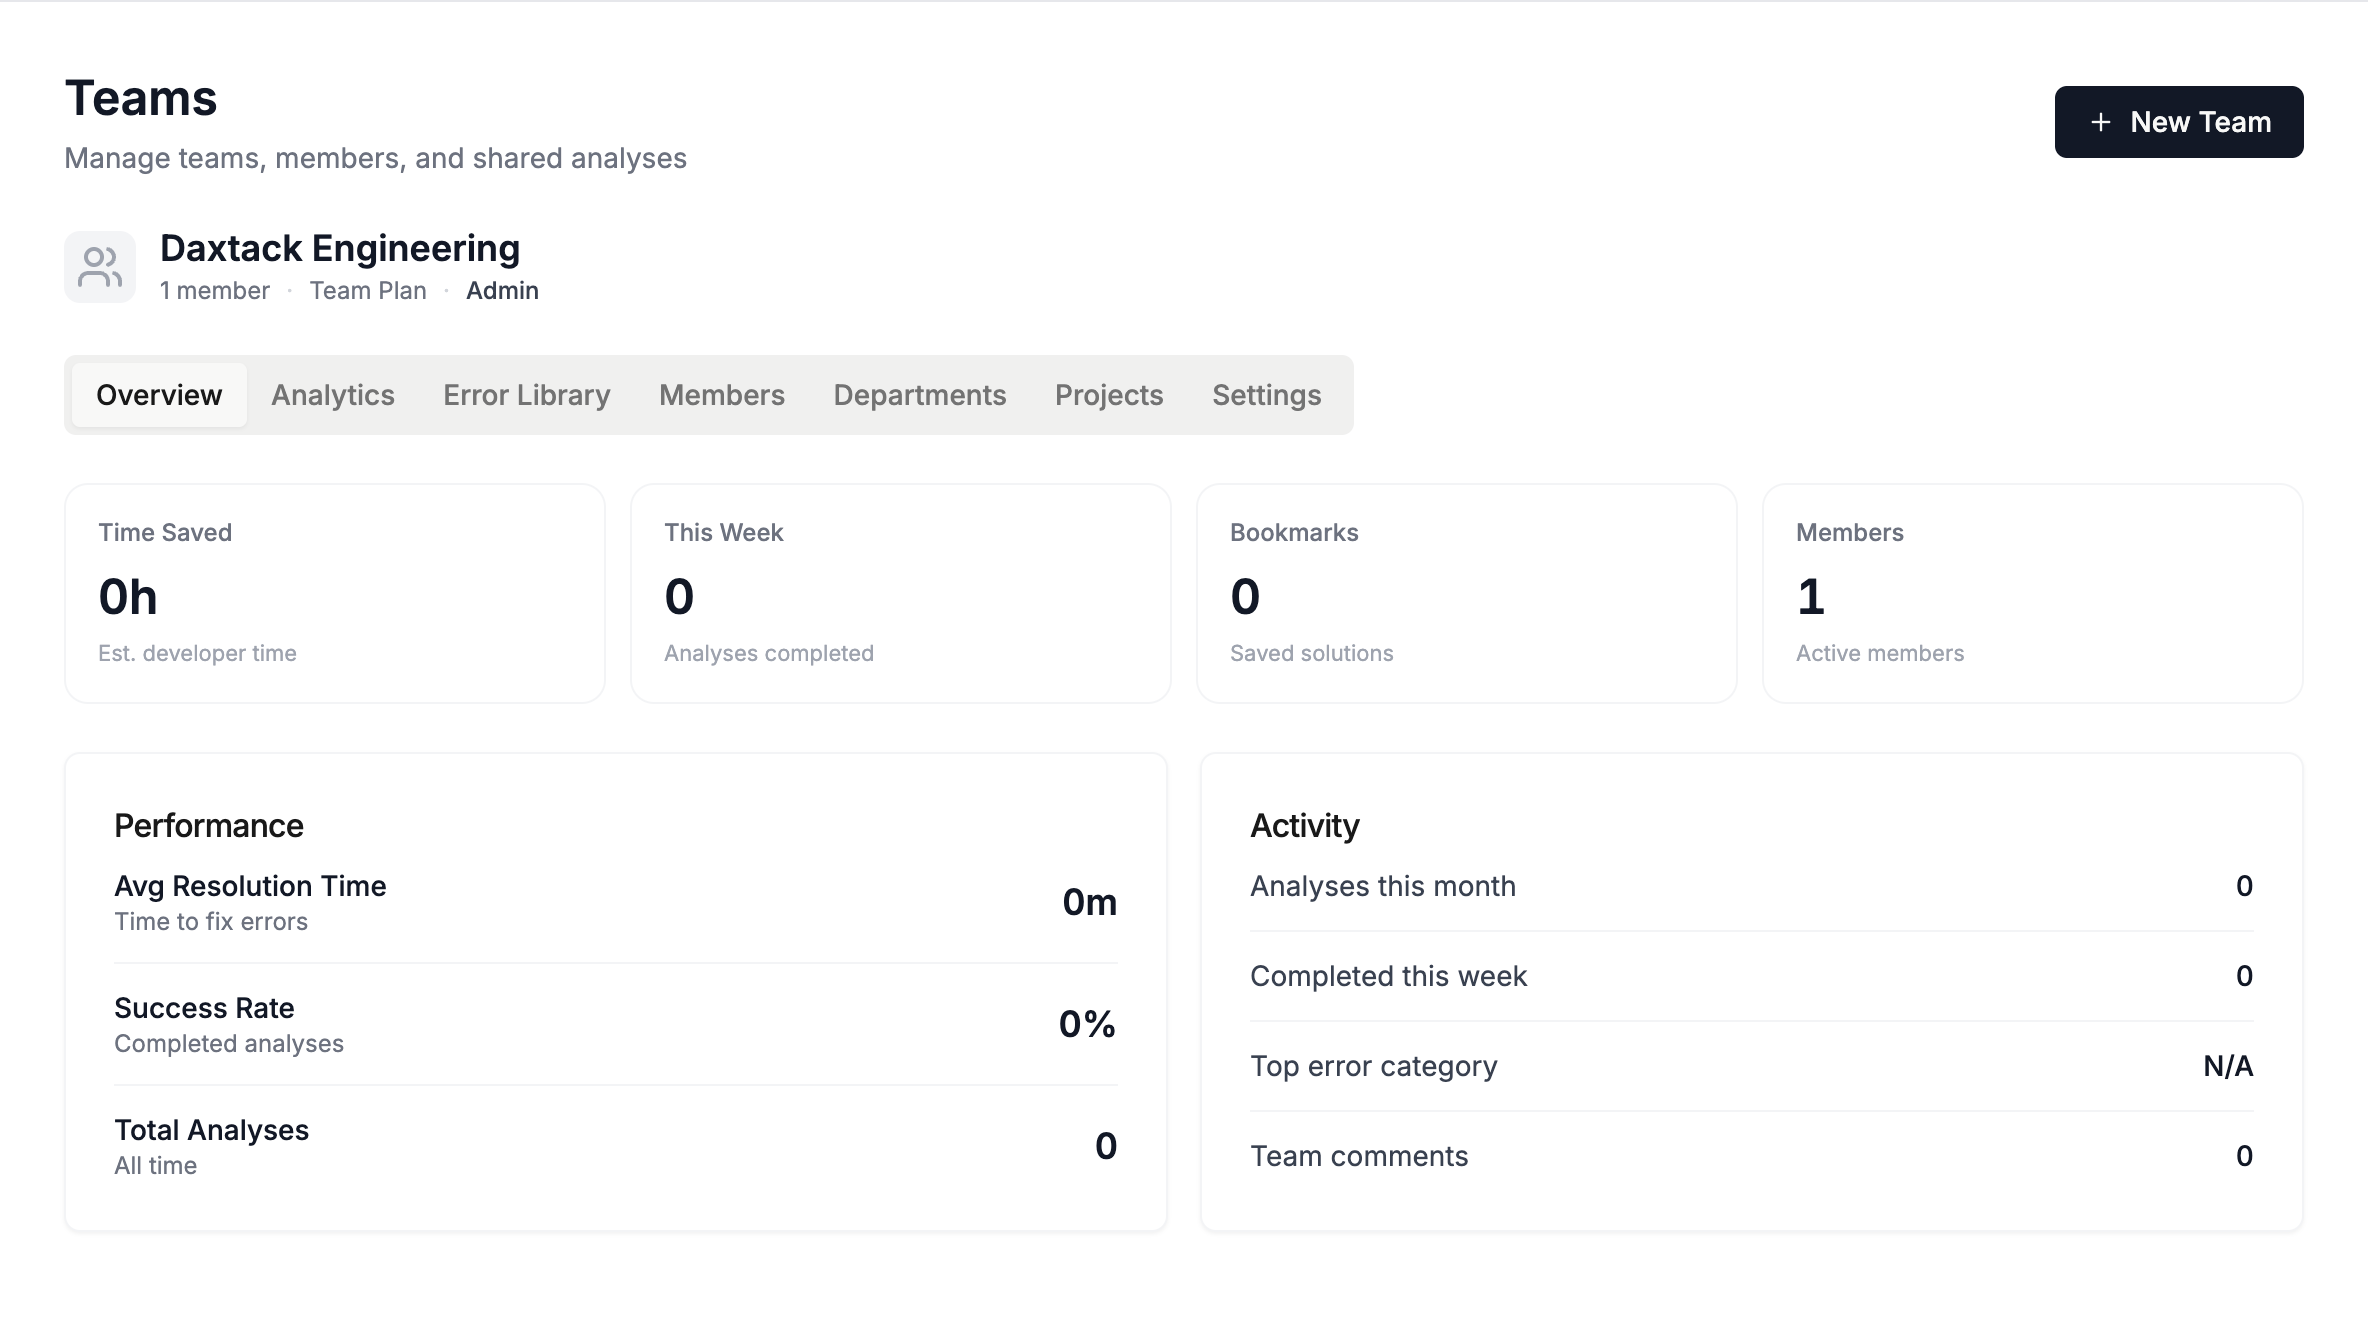
Team Workspace
Collaborate seamlessly with shared fixes and insights.
Workflow Comparison
How we compare.
Platforms
Works with legacy CI
GitHub and GitLab have AI. Jenkins doesn't. Until now.
+ Any CI/CD platform with webhook support
Pricing
Choose your plan
Self-serve for individual teams. Sales-assisted when you need private deployment, procurement review, or rollout support.
Free
Try the workflow on real CI failures
- 30 analyses/month
- All CI platforms
- Basic error detection
- Shareable results
Pro
For individual engineers
- 200 analyses/month
- Priority processing
- API access
- GitHub integration
- Slack alerts
One-click CI analysis
Start with the free plan, or book a sales call if you need private deployment and rollout support.